ELEC-E7130 Assignment 1. Basic programming and processing data
Markus Peuhkuri
César Iván Olvera Espinosa
Yu Fu
2023-09-13
Prerequisites
For this assignment you need to know:
Programming basics (preferably Python)
Especially using an IDE to debug and run your code such as Vim, Visual Studio Code, Sublime Text 3, and more
The use of some basic Linux commands
If you are not very familiar with Linux and Python, you can
Watch the introductory video for this assignment. (You can find it in the video section of the course.) From the video, you can learn how to use the awk command. You may wish to apply it in tasks.
For each task, complete the exercises and write the report. In addition to task-specific questions, describe your solution, including samples of produced data (few lines). Besides, you can add scripts/programs as a zip archive (submission is instructed separately).
Always make sure you have included all details in your answers and have answered every item.
Note: You can also perform task 2 and 3 with your own computer (real or virtual) by downloading the files needed.
Recommendation: There are several cheat sheet availables that you can consult related to the tools (awk, Python, R) and libraries (pandas, matplotlib) with the most useful information related to syntax, functions, variables, conditions, formulas, and more.
Task 1: Programming tools
In the first task, answer the following questions:
What is the function of the command awk? How does the awk command work? Could you give at least three examples highlighting its usefulness?
Compare the similarities and differences between Python and R, and explain in which situations Python is more suitable and in which situations R is more suitable. Provide three examples for each.
HINT: Consider in terms of programming experience, applications, plotting, or more.
What are three commonly used data analysis libraries in Python and R? Provide a brief description of the functionality of each library.
How would you personally define latency and throughput based on your understanding? Please provide two methods for measuring latency and two methods for measuring throughput.
Task 2: Processing CSV data using awk
For this task, you need to compute statistical values from a large (462 MiB) CSV file called log_tcp_complete which reports every TCP connection that has been tracked by the tool called tsat (more information in the documentation).
! The file is a space-separated CSV file with 130 columns and 886467 records (where the first line refers to the header). As it is of significant size, you may not be able to copy it over to your Aalto home directory. Tip: use symbolic link as a shorthand.
The course has its folder in the Aalto Linux computers located in the directory: /work/courses/unix/T/ELEC/E7130/. Following this path, it has the next directory general/trace/tstat/2017_04_11_18_00.out/ to find the file for this task.
Note: You may need to type the command kinit before to get access to the folder.
Provide the following answers (in addition to the description of your solution):
How can you peek at a file if it is too large to fit into memory?
Print the first line (i.e. headers of the columns 3, 7, 10, 17, 21, 24)
Calculate the average of the columns 3, 7, 10, 17, 21, 24
Calculate the percentage of records where column10/column7 exceeds a) 0.01, b) 0.10, c) 0.20 (in other words, the value in column 10 is divided by the value in column 7 for each line and the result must exceed the values indicated)
Calculate the maximum of each column: 3, 9, 17, 23, 31
HINT: Use the command awk (awk cheatsheet) to process the information requested from the second exercise. Moreover, you can use the built-in variable FNR as a condition, which refers to the record number (typically the line number) in the current file.
Task 3: Processing throughput and latency data
You must develop a code to process two CSV files: one of latency data and another related to throughput data, to compute some basic measurements and plot basic graphs using Python or R as a first approaching to processing and analyzing the data.
Note: The files can be found in the directory: /work/courses/unix/T/ELEC/E7130/general/basic_data.
3.1 Latency data using ping
The file ping_data.csv contains the latency data with the following information:
Datetime
Server
Transmitted packets
Successful packets
Avg RTT (ms)
1656437401.124931
195.148.124.36
5
5
0.92
1656438001.463204
195.148.124.36
5
0
inf
1656438602.081979
195.148.124.36
5
3
0.949
…
…
…
…
…
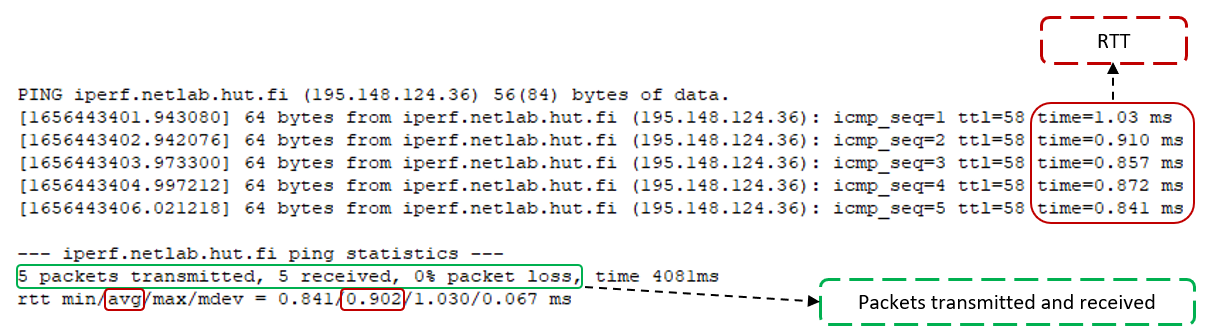
NOTE: Every row or line of the CSV file refers every ping executed to send 5 ICMP echo requests (packets) to the server 195.148.124.36 every 10 minutes. Moreover, there are some packet losses to be consider during the computing and plotting.
The CSV file was created from ping outputs extracting the useful parameters in terms of latency and connectivity (as shown in the figure below).
Example of ping output
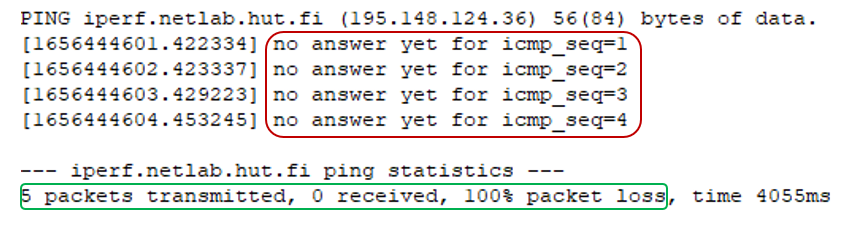
On the other hand, the next figure shows the scenario when there are packet losses during the transmission, which is considered important in terms of measurement and analysis, where it is defined as ‘inf’ in the CSV file when all packets sent were lost, or there may be a value in the ‘Avg RTT (ms)’ column but not all packets were sent successfully.
! You must be aware that there are pings without any answer or with some losses
Example of ping output with packet losses
You need to complete the following points:
Load the CSV into a DataFrame and change the timestamp to date format.
Plot the average RTT over a time series from the provided CSV file as a first approach to the data and analysis of this.
Generate another CSV file or dataframe with the values calculated of the average of successful RTTs, the maximum of RTTs, and the percentage of packet loss every hour.
Plot another time series to observe the behavior of the RTTs (average and maximum) according to the measurements calculated in each hour.
Can you make any conclusions of stability and latency based on data?
HINT: The column ‘Avg RTT (ms)’ only considers the successful RTT
3.2 Throughput data using iperf3
The CSV file called iperf_data.csv contains the throughput data both normal and reverse direction, that is, client-server (client sends, server receives) and server-client (server sends, client receives) respectively; in order to compute and plot the measurements requested.
Datetime
Server
Port
Type
Mode
Sent bitrate (bps)
Sent bytes
Retransmissions
1656437461
ok1.iperf.comnet-student.eu
5206
TCP
0
141364340.31318378
176706680
23
1656437472
ok1.iperf.comnet-student.eu
5201
TCP
1
620303404.7144992
775452064
13
-1
-1
-1
-1
-1
-1
-1
-1
…
…
…
…
…
…
…
…
NOTE: Every row of the file defines an iperf3 executed every hour either the mode normal or reverse. Besides, the column ‘Mode’ defines the direcion where ‘0’ refers the normal mode (client-server) and ‘1’ defines the reverse mode (server-client).
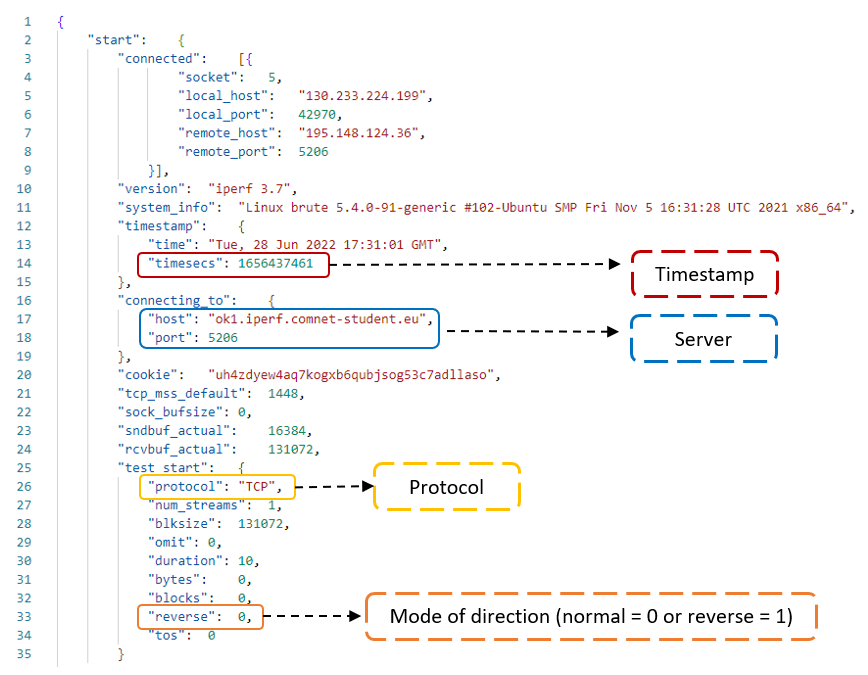
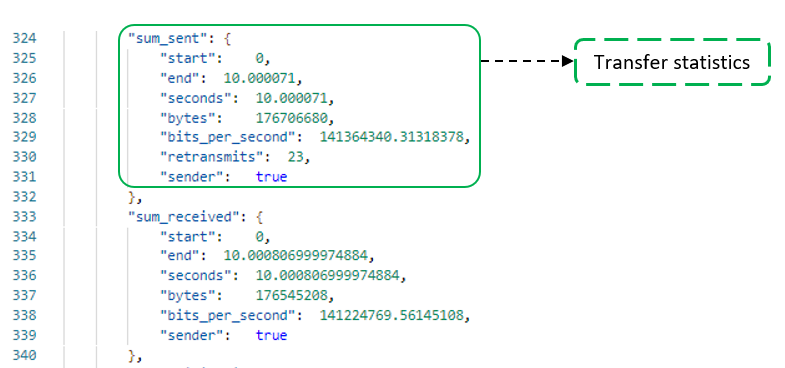
The CSV file was created from JSON files created by after running iperf3 extracting the useful parameters (as shown in the figure below) related to throughput and connectivity.
Example of iperf output from a JSON fileParameter related to the transfer statistics (bitrate, retransmissions)
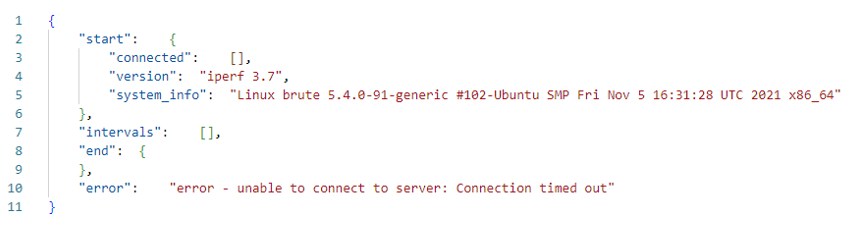
It is important to mention there are sometimes issues related to the connection between client and server causing an error or failure (as shown in the next figure) to measure the throughput which is represented with values ‘-1’ in the CSV file.
You must be aware that there are JSON files with an error as the next sample.
Example of iperf output with an error
You need to complete the following exercises:
Load the CSV into a DataFrame and change the timestamp to date format.
Remove the rows with values “-1” and classify the mode sent based on the column ‘Mode’, where ‘0’ is normal (client-server) and ‘1’ refers to reverse (server-client)
Plot comparing bitrate and TCP retransmissions over a time series (one for normal direction and one for reverse)
Create a scatter plot to observe the relationship between TCP retransmissions and bitrate (one for normal direction and one for reverse)
Can you make any conclusions of stability based on data and relationship between bitrate and TCP retransmissions?
Hint: As recommendation, you need to handle the data set using Dataframes with either Python or R due to in it will be useful when you have to work in terms of machine learning.
Grading standard
To pass this course, you need to achieve at least 15 points in this assignment. Moreover, if you submit the assignment late, you can get a maximum of 15 points.
You can get up to 30 points for this assignment:
Task 1
Explain the questions related to the programming tools. (3p)
Task 2
Successfully use the right way to peek on file with good explanation. (1p)
Successfully print the first line based on the columns requested (1p)
Successfully calculate the averages of the given columns. (2p)
Successfully calculate the percentages of the records. (2p)
Successfully find the largest values. (2p)
Task 3
3.1 Latency data using ping
Handle the CSV data into a DataFrame and change to date format (1p)
Plot a time series of avg RTT (1p)
Calculate the measurements requested every hour into a DataFrame (6p)
Plot a time series comparing the values of RTT average and maximum calculated in each hour (2p)
Analyse stability (bonus 2p)
3.2 Throughput data using iperf3
Handle the CSV data into a DataFrame and change to date format (1p)
Filter data properly (2p)
Calculate the measurements requested (2p)
Plot a time series and a scatterplot comparing bitrate and TCP retransmissions (4p)
Analyse stability (bonus 2p)
The quality of the report (bonus 2p)
The instruction of assignment
For the assignment, your submission must contain (Please do not contain original data in your submission):
A zip file that includes your codes and scripts.
A PDF file as your report.
Regarding the report, your report must have:
A cover page indicating your name, student ID and your e-mail address.
Solution to each problem.
An explanation of each problem, explain how you solved it and why you did it.